How to Find Restaurant Space for Lease Near You
Restaurant spaces in secondary markets list for $12-$25/SF/year. Here is how commercial leases work, where to search, and what to negotiate before signing.
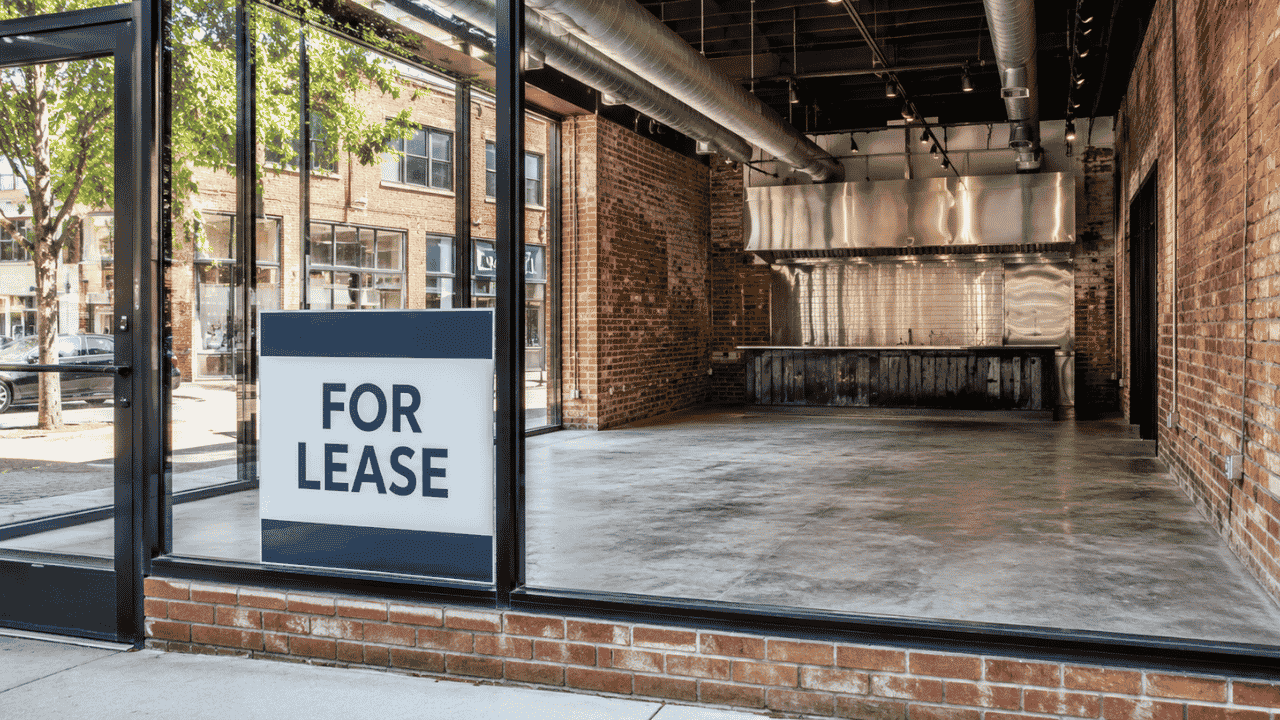
What "Restaurants for Lease Near Me" Actually Returns
Searching for restaurants for lease near me pulls commercial real estate listings, not residential apartments. This is a commercial search, and the tools are different. Restaurant spaces in secondary markets list for as little as $12 to $25 per square foot per year (as of Q3 2026), while prime urban corridors can run $80 to $200+ per square foot per year (as of Q3 2026). If you are a prospective restaurant operator evaluating your first location, expanding, or moving out of a commissary kitchen in cities like Houston or Dallas, this guide covers where to search, how pricing works, and what to negotiate before you sign.
Based on the search patterns brightplace tracks, "restaurants for lease near me" consistently pulls commercial real estate results, not property inventoryings. The platforms, lease structures, and terminology are entirely different from residential rentals. Understanding that distinction is the first step toward an efficient search.
Where to Search for Restaurant Space for Lease
Online Commercial Listing Platforms
The most effective starting points for finding restaurant space for lease are commercial listing platforms that allow filtering by property use type. Start with LoopNet, the largest commercial real estate listing database in the U.S. Filter by "Restaurant" or "Food and Beverage" under property subtype, then enter your target ZIP code or city.
Crexi is a growing alternative with particular strength in South and Southwest markets. Both platforms let you sort by square footage, asking rent, and lease type. CoStar is the institutional database that powers much of the commercial brokerage industry, but direct access requires a paid subscription. Most operators encounter CoStar data through their broker.
Local Tenant-Representation Brokers
Local commercial brokers carry listings that never reach public platforms. A tenant-representation broker works on your behalf at no cost to you; the landlord pays the commission. If you are searching in a specific city, contacting two or three local tenant-rep brokers will surface off-market spaces that LoopNet and Crexi do not show.
How to Read a Commercial Listing
Commercial restaurant listings look different from anything in residential real estate. The asking rent is quoted in dollars per square foot per year, not as a monthly figure. A listing showing "$24/SF/year" for a 1,500 SF space means a monthly base rent of $3,000. The formula: (asking rent per SF x total SF) / 12 = monthly base rent.
Pay attention to the lease type. A NNN (Triple Net Lease) is a lease structure in which the tenant pays base rent plus their proportionate share of property taxes, building insurance, and maintenance costs. Those NNN charges add $3 to $30 per square foot per year (as of Q3 2026) depending on the market, and they come on top of the asking rent.
Infrastructure notes matter enormously. Listings that mention existing kitchen infrastructure describe a space that could save you six figures in buildout. Key infrastructure to look for:
Hood exhaust system
Grease trap
Gas lines
Walk-in cooler
A listing that says "vanilla shell" or "white box" means you are building everything from scratch.
How Restaurant Lease Pricing Works
Total Occupancy Cost
Restaurant lease pricing varies dramatically by location. Asking rents are only one component of your total occupancy cost. NNN charges, common area maintenance fees, and required buildout costs compound the real monthly cost well beyond the listed rent figure.
Secondary/rural: $12-$25/SF/year asking rent (as of Q3 2026), $3-$6/SF NNN. More negotiable.
Mid-size city: $20-$45/SF/year asking rent (as of Q3 2026), $5-$10/SF NNN. Varies by corridor.
Major metro (non-prime): $35-$80/SF/year asking rent (as of Q3 2026), $8-$15/SF NNN. High variance.
Prime urban corridor: $80-$200+/SF/year asking rent (as of Q3 2026), $15-$30/SF NNN. Manhattan, WeHo, etc.
Calculating Monthly All-In Costs
Restaurant spaces in secondary markets typically ask $12 to $25 per square foot per year (as of Q3 2026), converting to roughly $1,000 to $2,100 per month for a 1,000 SF space. A 2,000 SF space in a mid-size city at $30/SF NNN with $8/SF in triple net charges could run $6,333/month all-in. Run the full calculation before scheduling a tour.
How a Restaurant Lease Actually Works
The Leasing Process
The restaurant leasing process starts with identifying spaces and ends with a signed lease, but several critical steps happen in between:
- Find and evaluate potential spaces.
- Submit a Letter of Intent (LOI), a non-binding document that outlines the proposed lease terms before a formal lease agreement is drafted, used to negotiate key terms before legal costs are incurred.
- Negotiate the LOI terms (see below).
- Engage a real estate attorney to draft the formal lease.
- Sign the lease and begin buildout.
Key LOI Terms
The LOI covers the following key terms:
Rent
Lease term
Tenant Improvement Allowance (TI) (money the landlord provides toward buildout costs, typically expressed in dollars per square foot of leased space)
Free rent during construction
Personal guarantee scope (a requirement that the tenant personally backs the lease obligations, meaning the landlord can pursue the individual's personal assets if the business defaults)
Most restaurant landlords require lease terms of 5 to 10 years, with at least one 5-year renewal option negotiated at signing.
Contact the Health Department Early
One step that saves significant money and delays: contact your local health department before signing, not after. Operators who engage environmental health inspectors during the LOI phase can identify code requirements, kitchen layout issues, and permitting timelines that would otherwise become expensive surprises mid-buildout. This costs nothing and can prevent five-figure change orders.
What the 30/30/30 Rule Means for Restaurant Operators
The 30/30/30 rule is an industry guideline stating that roughly 30% of revenue goes to food cost, 30% to labor, and 30% to all other overhead costs including rent, leaving approximately 10% as net profit margin. This rule directly determines how much rent you can afford.
Under the 30/30/30 rule, rent and occupancy costs should ideally stay below 6 to 10% of projected gross revenue to preserve operating margin. If your projected monthly revenue is $50,000, your total rent and occupancy payment (base rent plus NNN plus insurance) should stay under $3,000 to $5,000. Exceeding that range compresses your margin toward zero.
The SBA's restaurant financing resources provide additional frameworks for projecting startup and occupancy costs alongside revenue estimates.
Second-Generation vs. Raw Space: What the Difference Costs You
What a Second-Generation Space Includes
A second-generation restaurant space is a previously operated restaurant that retains existing kitchen infrastructure. This distinction is the single most important filter when evaluating listings. Key infrastructure in a second-gen space typically includes:
Hood exhaust
Grease trap
Gas lines
Walk-in cooler connections
Buildout Cost Comparison
Buildout costs for raw commercial space can run $250 to $500 per square foot or more (as of Q3 2026), with a national median around $404/SF and average near $450/SF. Second-generation spaces with existing infrastructure run $125 to $250 per square foot with existing infrastructure. For a 1,500 SF restaurant, that difference is $187,500 to $375,000 in buildout savings.
The tradeoff: well-located second-gen spaces go quickly because landlords price them to reflect the infrastructure value. Raw spaces linger longer on listing platforms but cost significantly more to occupy. If you find a second-gen space with a functional Type 1 hood, grease interceptor, and adequate gas line capacity, the math almost always favors it, even at a higher base rent. If you are also evaluating which city to open in, brightplace's neighborhood guides for relocating professionals can help you assess dining corridors and foot traffic patterns by area.
Key Terms to Negotiate Before You Sign
Negotiation happens at the LOI stage, not after the lease is drafted. These five terms should be addressed before you engage a real estate attorney:
- TI allowance.Landlord-provided tenant improvement allowances typically range from $25 to $50 per square foot in many markets (as of Q3 2026), though the actual cost to build out restaurant space runs $110 to $285 per square foot depending on concept type. In tight urban markets, TI may be minimal or absent. Push for the highest TI the landlord will offer. Rising restaurant vacancy in 2026 gives tenants more leverage to negotiate better TI, free rent periods, and reduced personal guarantees.
- Percentage rent.Many restaurant leases include a percentage rent clause requiring 5-8% of gross sales above a breakpoint. Define "gross sales" narrowly to exclude catering, merchandise, and gift card revenue. Negotiate audit rights and confirm how the breakpoint is calculated.
- Free rent period.Request 3 to 6 months of free rent during buildout and permitting. You cannot generate revenue while construction is underway.
- Personal guarantee scope.Try to limit the personal guarantee to 1 to 2 years rather than the full lease term. This reduces your personal financial exposure if the business does not perform.
- Options to renew.Negotiate at least two 5-year renewal options at signing. Without renewal options, you risk losing your location after investing heavily in buildout.
- Co-tenancy protections.If your space is in a retail center, include a clause that reduces your rent obligation if the anchor tenant leaves. Foot traffic drops when anchors close.
A tenant-rep broker can negotiate these terms on your behalf at no cost to you. The landlord pays the broker commission. Understanding your true monthly cost before committing ensures you account for every line item beyond base rent.
Small and Affordable Restaurant Spaces: What to Expect
Budget-Level Traditional Spaces
Spaces under $1,000/month (as of Q3 2026) exist primarily in rural secondary markets and very small square footages under 500 SF. A 1,000 SF space in a secondary market at $20/SF NNN might run $2,500 to $3,500/month all-in (as of Q3 2026). That is typically the realistic floor for a functional restaurant with cooking infrastructure.
Ghost Kitchens and Commissary Alternatives
Ghost kitchen memberships and commissary kitchens offer an alternative for early-stage operators who are not ready for a full lease commitment, similar to how short-term lease agreements reduce commitment on the residential side. Monthly memberships run $2,000 to $10,000 (as of Q3 2026) depending on the market, but they eliminate buildout costs entirely. For operators building a proof of concept before signing a long-term lease, this path reduces risk considerably. The apartment lease walkthrough process shares some structural similarities with commercial leasing, though the terms and stakes differ significantly.
Frequently Asked Questions About Leasing Restaurant Space
1. How much does it cost to lease a restaurant space?
Restaurant lease costs depend on market tier and space size. Secondary markets run $12 to $25 per square foot per year (as of Q3 2026), while prime urban corridors reach $80 to $200+ per square foot per year. A 1,500 SF space in a mid-size city typically costs $3,500 to $6,500 monthly all-in, including NNN charges.
2. What is the 30/30/30 rule for restaurants?
The 30/30/30 rule allocates roughly 30% of gross revenue to food cost, 30% to labor, and 30% to all remaining overhead including rent. The remaining 10% represents net profit margin. This framework means rent and occupancy costs should stay below 6 to 10% of projected gross revenue to maintain viable margins.
3. How does leasing a restaurant work?
Restaurant leasing begins with searching commercial platforms like LoopNet or Crexi, then submitting a Letter of Intent to the landlord. Negotiation covers rent, tenant improvement allowance, free rent period, and personal guarantee terms. After the LOI is accepted, a formal lease is drafted. The entire process takes 30 to 90 days.
4. What does $10/SF/year mean in a commercial lease?
A listing priced at $10 per square foot per year means you pay $10 annually for each square foot of leased space. For a 2,500 SF restaurant, that equals $25,000 per year, or approximately $2,083 per month in base rent. NNN charges add property taxes, insurance, and maintenance costs on top of that figure.
5. What is a second-generation restaurant space?
A second-generation restaurant space was previously operated as a restaurant and retains existing kitchen infrastructure: hood exhaust, grease trap, gas lines, and walk-in cooler connections. Buildout costs for second-gen spaces run $75 to $150 per square foot (as of 2026), compared to $200 to $400+ per square foot for raw space.
6. What should I negotiate before signing a restaurant lease?
Negotiate tenant improvement allowance, free rent during buildout, personal guarantee scope limited to one or two years, at least two five-year renewal options, and co-tenancy protections if located in a retail center. Address all five items at the Letter of Intent stage before legal costs are incurred. A tenant-rep broker handles this at no cost to you.
7. Do I need a broker to find restaurant space for lease?
A broker is not required, but a tenant-representation broker works on your behalf at no cost to you because the landlord pays the commission. Tenant-rep brokers access off-market listings, negotiate TI allowances, and manage the LOI process. For first-time operators, broker representation provides meaningful value without adding expense.
8. What is a personal guarantee in a restaurant lease?
A personal guarantee requires the tenant to personally back the lease obligations with their own assets. If the restaurant business defaults on rent, the landlord can pursue the individual's personal finances, not just the business entity. Negotiate to limit the guarantee to one or two years rather than the full lease term.
If you are evaluating a new market for your restaurant, the neighborhood matters as much as the lease rate. brightplace maps out dining corridors, foot traffic infrastructure, and walkability across major U.S. cities. See what is opening up at brightplace.ai.
If you are also deciding which city to open in, brightplace's city orientation guides can help you evaluate foot traffic, dining density, and lease market dynamics by area.
How this article was made: brightplace used AI tools to help research, draft and update this article.